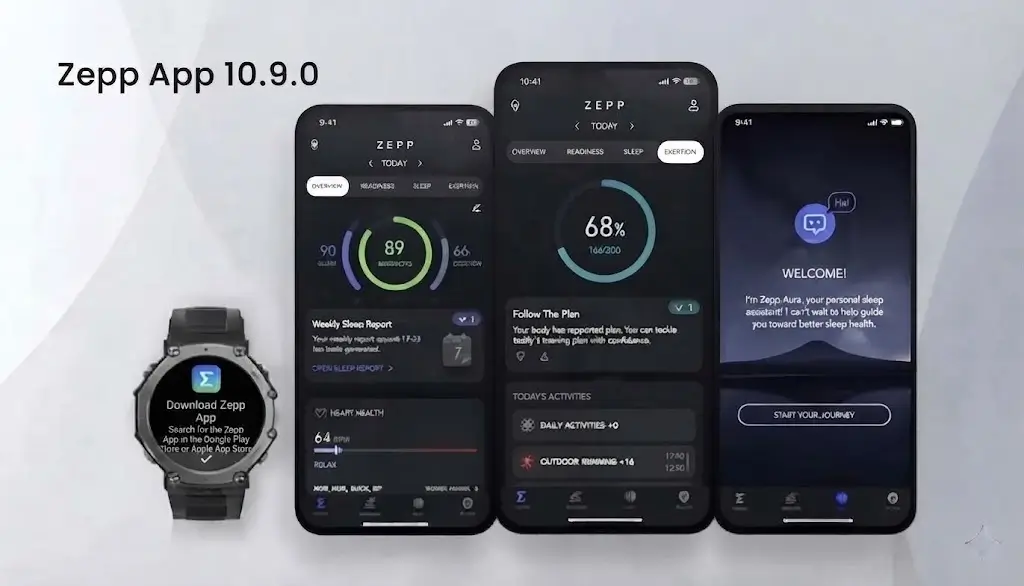
Amazfit is rolling out a brand new update for its companion application, bringing the Zepp app to version 10.9.0. This update focuses heavily on improving how users track and analyze their daily life load and wellness data, alongside a few nice additions for training plans.
Here is a breakdown of everything new in Zepp 10.9.0.
1. New Time Views: 1-Month and 3-Month Tabs
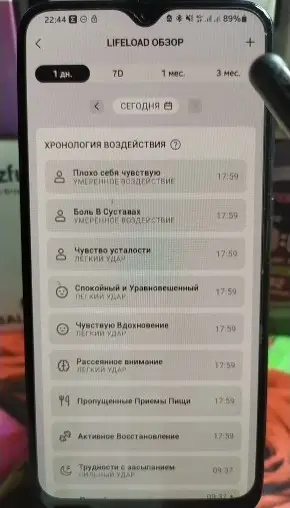
When looking at your life load statistics, the app previously focused mostly on weekly data. With version 10.9.0, Amazfit has added two brand new tabs: 1 Month and 3 Months.
Both of these new tabs bring the same core features found in the weekly view, but expanded over longer periods, making it much easier to spot long-term wellness trends and habits.
2. A Redesigned Weekly Interface and Heatmap
The weekly statistics page has received a completely fresh look, highlighted by two main additions:
-
The Heatmap Card: At the top of the page, you will now see a “Heatmap” section. Tapping it lets you view all your life load patterns that you have saved to your favorites. By selecting individual patterns, you can check your weekly stats and see how you rated specific days.
-
The Correlation Chart: This new chart helps you understand how different habits affect your body. A helpful pop-up reminder notes that factors like physical activity and sleep also play a role in metrics like your morning readiness, meaning life load is just one part of the puzzle.
Using the correlation chart, you can choose from four different health metrics to see daily stats. You can swipe across the chart to view detailed data for specific days—for example, seeing how your sleep score changed compared to your baseline due to patterns like “poor sleep” or “trouble falling asleep.”
You can also change or combine your chosen patterns right above the chart. The app allows you to select up to two patterns at the same time to see how they impact your chosen health metrics.
3. Expanded Charts and Calendar Tracking
For the 1-month and 3-month views, Amazfit added a handy full-screen expand button on the side of the correlation chart. Tapping this icon lets you view your charts in full screen for a much closer look at your daily numbers.
Below the charts, you will find a list of your “top events”—the life load patterns you use most frequently. Furthermore, a calendar view has been integrated to help you track your logging habits. A red dot under a specific day means you logged your life load data that day, while a missing dot indicates that you forgot to log it.
4. Updated Pattern Rating System
The way you rate your life load patterns has also been updated. When you open the ratings section, you will notice that certain patterns now feature a new 1-to-4 point rating scale, while others keep their previous layout or use simple toggle buttons.
5. New Training Plans (HRX)
Finally, runners and athletes will find a nice surprise under the hood. If you go to My Training, open My Training Plans, and try to add a new plan, you will now see four new HRX-related training plans. Testing shows these plans don’t appear in older versions (like Zepp 10.8.1), confirming they are a new addition in version 10.9.0.
You May Also Like To Check Out: The New and Latest Smartwatches 2026